Thursday, August 1, 2019

Stock Prices ETL :TD Ameritrade API

I was think few days back about how BI could work with Stock Prediction.
To do it first I needed regular stock price data from the internet.
So to do it I wrote a quick code in Python to get stock prices from TD Ameritrade API.
So once I have the data feeding in regulary I will write the next post of prediction algorithms.


Here is the code:
SQL Table:
CREATE TABLE [dbo].[Stocks_Price](
[Symbol] [varchar](10) NOT NULL,
[Open] [float] NULL,
[High] [float] NULL,
[Low] [float] NULL,
[Close] [float] NULL,
[volume] [float] NULL,
[TransDate] [date] NOT NULL
)

The python code has a Start and End date which can be modfied the way you want.
The symbols for which we get prices for is in the file Symbols.txt.
Symbols.txt has only text as shown below for all the stocks
AAPL
AABA
TSLA

The list of all Symbols on Nasdaq can be found here
ftp://ftp.nasdaqtrader.com/symboldirectory/
nasdaqlisted.txt


You can run the following Python code and make changes for your APIKey, SQL Server adddress. SYmbols file path.
Python Code:
import requests
import json
import pyodbc
import datetime
import time

start_date =int(datetime.datetime.timestamp(datetime.datetime.strptime('07 20 2019  1:33PM', '%m %d %Y %I:%M%p')) * 1000)
end_date   =int(datetime.datetime.timestamp(datetime.datetime.strptime('08 02 2019  1:33PM', '%m %d %Y %I:%M%p')) * 1000)

file= open(r'''C:\Stocks\Symbols.txt''',"r")
   
for x in file:
    symbol_name= x.strip()   
    endpoint=r"https://api.tdameritrade.com/v1/marketdata/{}/pricehistory".format(symbol_name)
   
    #payload=   { 'apikey':'Your API KEY',
    #             'periodType':'year',
    #             'frequencyType':'daily'                     
    #            }

    payload=   { 'apikey':'Your API KEY',
                 'periodType':'year',
                 'frequencyType':'daily' ,
                 'startDate':start_date,
                 'endDate':end_date
                }
    print(symbol_name)
   
    content= requests.get(url=endpoint,params=payload)
    data=content.json() 

    sqlconn=pyodbc.connect('Driver={SQL Server};'
                          'Server=.;'
                          'Database=NishDB;'
                          'Trusted_Connection=yes;')
    cursor= sqlconn.cursor()

    for row in data['candles']:

        currenttime = datetime.datetime.fromtimestamp(row['datetime']/1000).strftime('%Y-%m-%d')

        cursor.execute('''Insert into NishDb.dbo.Stocks_Price(Symbol,[Open],High,Low,[Close],volume,TransDate) values(?,?,?,?,?,?,?)''',
                       (symbol_name,row['open'],row['high'],row['low'],row['close'],row['volume'],currenttime))
        sqlconn.commit()

Monday, November 5, 2018

SSIS Error: Execute Sql Task failed

Error:
SQL SPLoadxxx:Error: Executing the query "EXEC SPLoadxxx ?" failed with the following error: "Multiple-step OLE DB operation generated errors. Check each OLE DB status value, if available. No work was done.". Possible failure reasons: Problems with the query, "ResultSet" property not set correctly, parameters not set correctly, or connection not established correctly.

When I executed the Stored procedure it executed perfectly.
So seems SSIS was not able to execute it properly and I found out that
"The Execute SQL Task" in SSIS  "Parameter Mapping" had an extra parameter which was not been used by the Stored procedure.


Wednesday, September 7, 2016

SSAS 2012 Tabular Cube:Attributes(columns) not visible

Issue is where your table in the model diagram has both Measure and Attributes and you add a new column to the table in model diagram.
After Cube deployment it only shows the Measures in the Client tool like Excel.
It did not show the new attribute which was added to the model table later.

Solution is to set the "Hidden" property on the properties windows of the newly added Attribute(Column) to "True" and click save and then change it to "False" again.

And now if you deploy then the new columns will show up as dimensions.
There is some bug so it doesnot take up the correct way when column added .


Friday, May 27, 2016

Convert Views to Tables

Recently I wanted to create a StoredProcedure to convert all the views which read millions of records to tables in a database.

The Reason being when we process a cube its always better if it reads from a simple view or a table.
So the ETL(SSIS) job will execute the view which is complicated and has many joins and look ups to a table which can be easily converted to a table and it can be read into the cube.

Here is code to convert all views ending with "_ToTable" to table with same name.
Example : dbo.SalesOrder_ToTable view will be converted to dbo.SalesOrder so having the same schema name (.dbo) as the view .

GO
DECLARE @View_Name varchar(255)

DECLARE MY_CURSOR CURSOR
  LOCAL STATIC READ_ONLY FORWARD_ONLY
FOR
SELECT SCHEMA_NAME(schema_id) +'.'+name AS view_name
FROM sys.views where name like '%_ToTable%'

OPEN MY_CURSOR
FETCH NEXT FROM MY_CURSOR INTO @View_Name
WHILE @@FETCH_STATUS = 0
BEGIN
DECLARE @Tablename_Name varchar(255)
Set @Tablename_Name = Replace(@View_Name,'_ToTable','')
IF OBJECT_ID(@Tablename_Name, 'U') IS NOT NULL  Exec('DROP TABLE '+@Tablename_Name)
Exec('Select * into '+@Tablename_Name+' from '+@View_Name )
    FETCH NEXT FROM MY_CURSOR INTO @View_Name
END
CLOSE MY_CURSOR
DEALLOCATE MY_CURSOR

Monday, February 29, 2016

SSAS: Dimension Parent Child Hierarchy recursive

In the last post I showed you know to build a Parent-Child Hierarchy. This time we implement the same Parent-Child Hierarchy in a different way. Building a Parent Child Hierarchy looks complicated but is easy if all the rules are followed correctly. I will here list down few steps which will help us building it better.

Scenario:
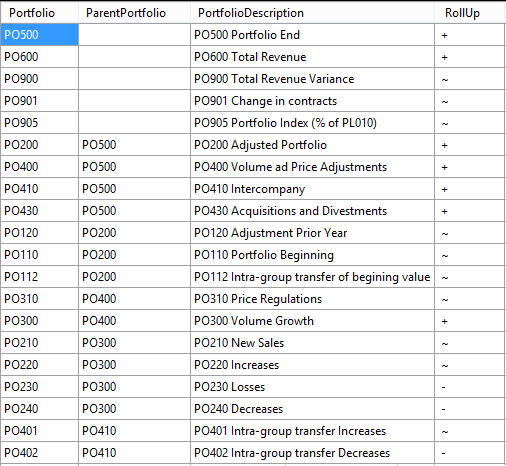
As you see below we have a simple table which you can build using SSIS and map the corresponding Parent and Child values.
Portfolio:
Primary Column With unique IDs.
ParentPortfolio:
Portfolio Id of the corresponding Parent.
RollUp:
Operator used while aggregrating values(Auto Sum) from Child to Parent node.
You can read more on RollUps here
https://msdn.microsoft.com/en-us/library/ms175417.aspx

Example: P0120 has Parent P0200 and P0200 has Parent as P0500


Step1:
 You can create a New SSAS Project and create the DataSourceView.
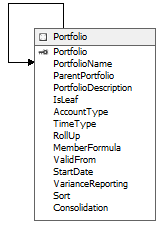
 After importing the table in the DataSource View we need to set the primary key.
Here Portfolio is set as Primary key.
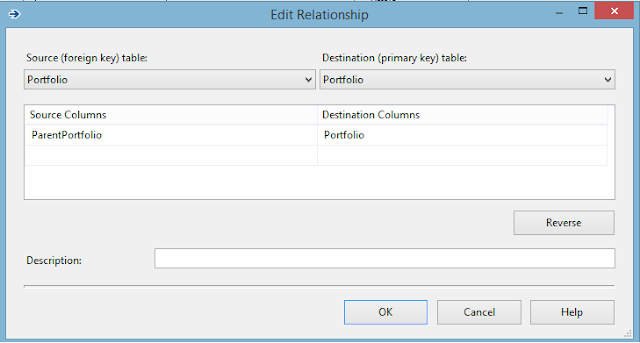
 After that a link is created between Portfolio and ParentPortfolio as shown below.


Step2:
Right Click "Dimension" folder in the Project in Visual Studio and Click "New Dimension".
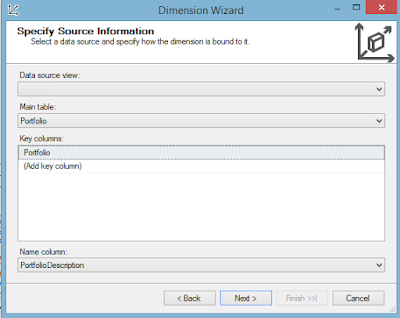
The Dimesnion wizard opens up as shown below.
Select Portfolio Column as Key Column and for display we show the ID+Name combination which is already  there in the Description Column.


Step3:
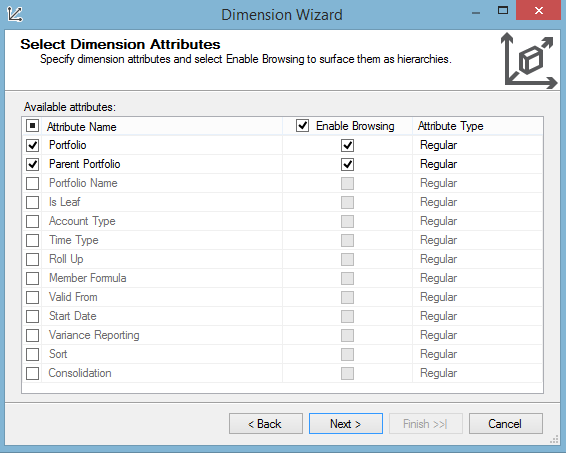
Select Portfolio and ParentPortfolio columns. You can add more columns like Name later on.


Step4:
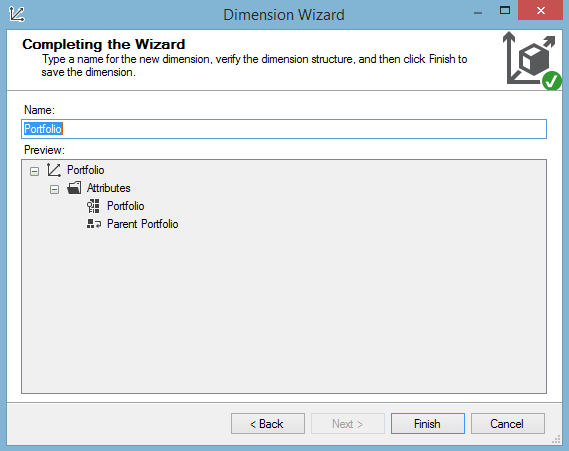
Name it "Portfolio".


Step5:
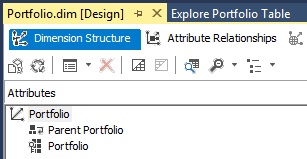
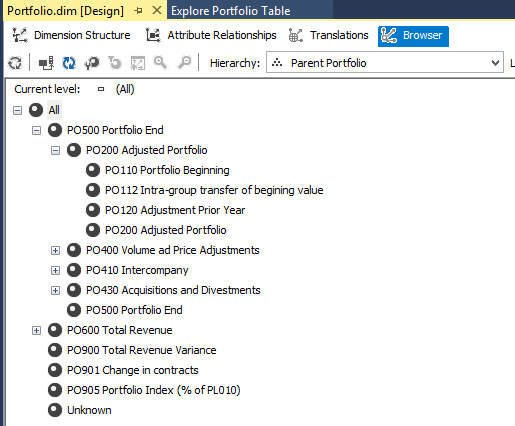
Process the Dimension. The output is shown below.


Step6:
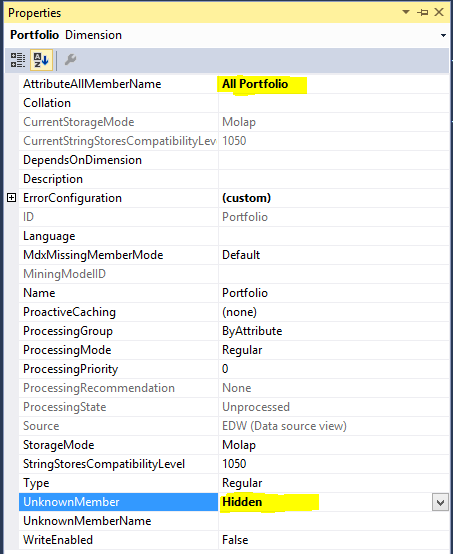
Now we need to get rid of the Unknown member and set Rollup operator. For the Portfolio Dimension set the following Properties:


Step7:
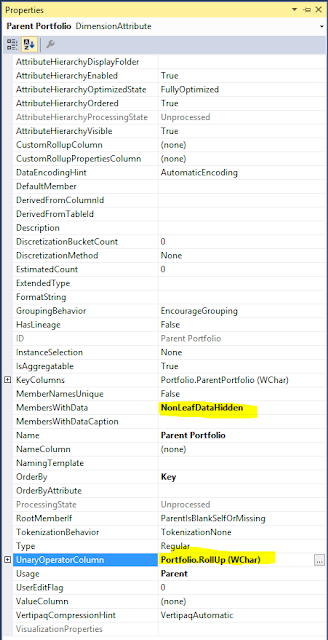
For Parent Portfolio Attribute set the following Properties:


Step 8:
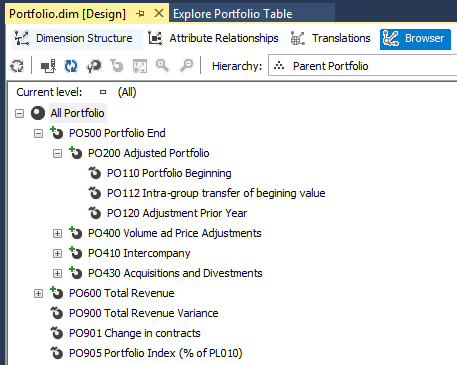
Process the Dimension:
The Unknown Level will disappear and all the Levels will have the Unary Rollup sign.


Step 9:
Rename "Portfolio" attribute to "Portfolio Flat" and "Parent Portfolio" to Portfolio.
The reason we do is because I want to name my hierarchy attribute as "Portfolio".
Its helps a lot and is very user friendly for the EndUser.


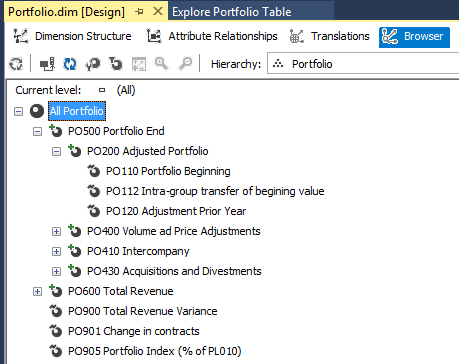
This is how it should look like:

Thursday, February 11, 2016

SSAS Dimension: Parent Child Hierarchy

Building a Parent Child Hierarchy looks complicated but is easy if all the rules are followed correctly. I will here list down few steps which will help us building it better.

Scenario:
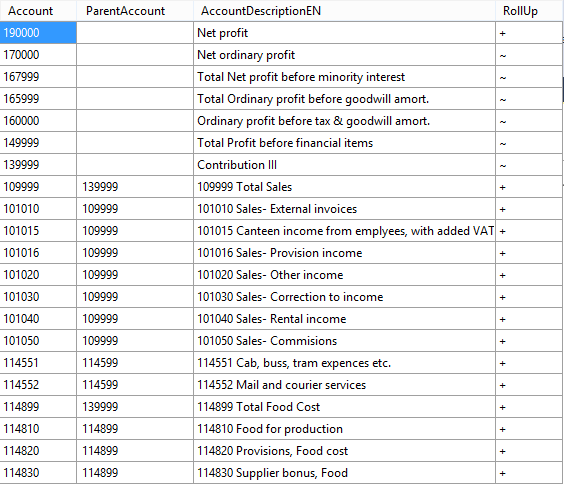
As you see below we have a simple table which you can build using SSIS and map the corresponding Parent and Child values.

Account:
Primary Column With unique IDs.
ParentAccount:
Account Id of the corresponding Parent.
RollUp: Operator used while aggregrating values(Auto Sum) from Child to Parent node.
You can read more on RollUps here
https://msdn.microsoft.com/en-us/library/ms175417.aspx

Example: 101010 has Parent 109999 and 109999 has Parent as 139999


 Step1:
 You can create a New SSAS Project and create the DataSourceView.
 After importing the table in the DataSource View we start creating the Dimension.
Right Click "Dimension" folder in the Project in Visual Studio and Click "New Dimension".
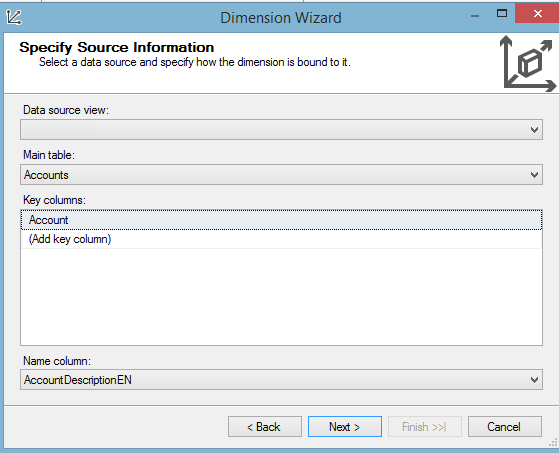
The Dimesnion wizard opens up as shown below.

Select Account Column as Key Column and for display we show the ID+Name combination which is already  there in the Description Column.


Step2:
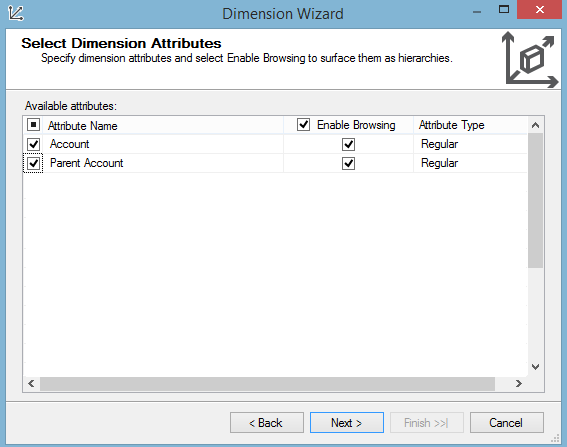
Select Account and ParentAccount columns. You can add more columns like Name later on.


Step3:
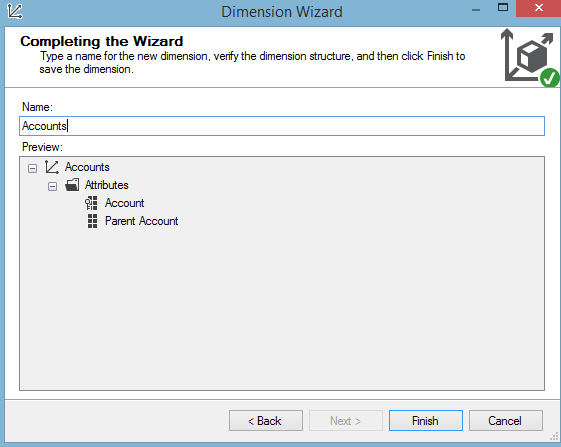
Name it "Accounts".


Step4:
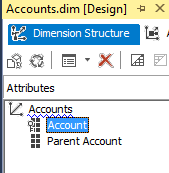
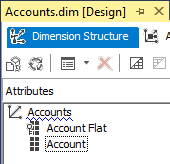
Rename "Account" attribute to "Account Flat" and "Parent Account" to Account.
So going forward Account attribute is "Parent Account".
The reason we do is because I want to name my hierarchy attribute as "Account".
Its a lot User friendly for the EndUser.


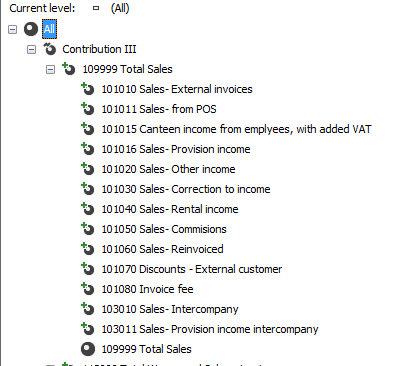
This is how it should look like:


Step5:
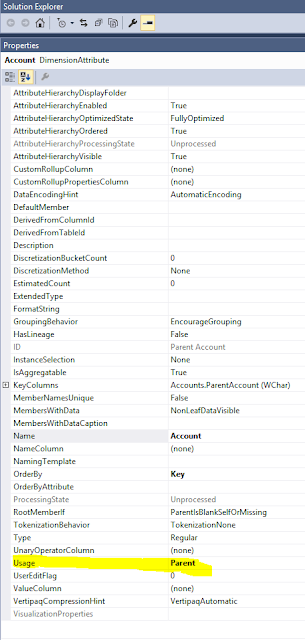
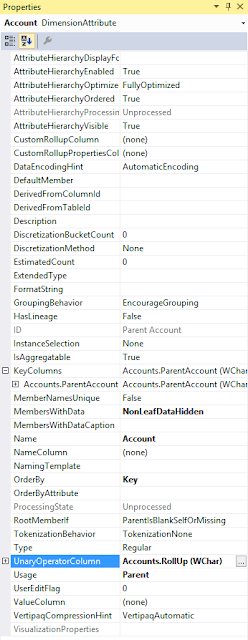
For the Account(orginally which was Parent Account) attribute set the following Properties:
usage:Parent.


Step6:
In the attribute relationships Windows delete the first relation shown below.


This is how it should look like:


Step7:
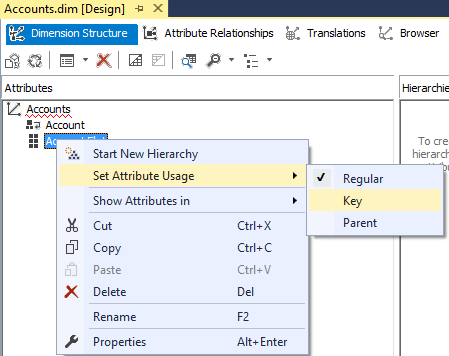
Set the "Account Flat" attribute as Key Attribute.


Step7:
Process the Dimension so we see how the hierarchy looks like now.


Step8:
Set following Properties:
MembersWithData:NonLeafDataHidden.
UnaryOperatorColumn:Account.Rollup


Step9:
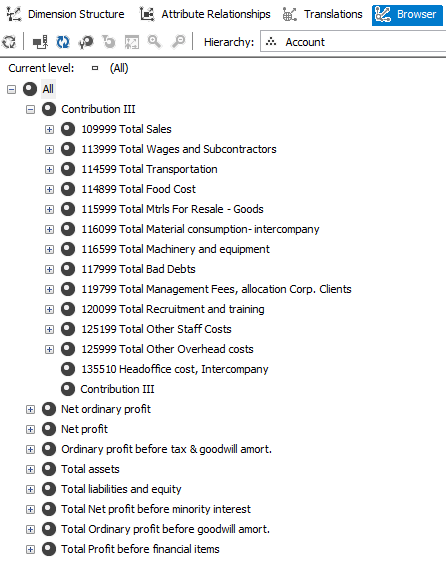
Process the Dimension again and you would see the following structure which you can use it in your BI reports.


Thursday, June 11, 2015

Bug: SQL 2014 SP1 truncates decimal values.

Hi ,
I noticed a wierd thing with SQL Server ServicePack 1 SQLServer2014SP1-KB3058865-x64-ENU.exe from
https://www.microsoft.com/en-us/download/details.aspx?id=46694

After installation when I executed a SQL query against a Linked Oracle Server I got the decimal values truncated and it only returned the value before the decimal seperator..it was not rounding off either. So a value like -2035.7654 was returned as -2035


After uninstalling the Service Pack1  I re-ran the same SQL Query and it started returning numbers with decimal seperator -2035.7654.

I hope Microsoft fixes it soon.